There’s a question I’ve heard a lot lately from new traders and I always chuckle – “When do I sell???”
The answer is, it depends! LOL
The first thing to understand is that you don’t want to have to manually execute every sell order in your account if you are a trader. This just means typically all of your sell orders will be executed with automated stop orders based on your best guess of that particular stock.
So the next logical question is where do I place my stop orders?… well the answer is, it depends, lol.
So to start, I have three different type of stops, or better said, there are three different situations with a stock position, which each require a different approach to stop management.
Three types of stops:
- Right after entry
- Moving stops during a trend
- After an explosive upside price move in a position YOU ALREADY OWN
Placing your first stop right after purchase
For me personally this is the most stressful part of trading! Placing a stop too close means getting stopped out prematurely, exiting from a potentially great trade. And of course, you can always do everything right, and still get stopped out right after purchase, we are just taking our best guess when we buy. So the $10,000 dollar question is where do we place the first stop after we enter?
We’ll talk more about this later, but for me, it depends a bit on how strong the chart is, i.e. – how much has price gone up in past 6 months? Another consideration is how volatile is the price action on the stock? If price is swinging a lot, a stop placed with a risk of 10% of cost may get you bounced from the position in a flash.
In general, I set my first stop 10% below purchase price and move it as soon as I get a run and pullback.
Moving stops During a Trend
Adjusting your stops while enjoying an uptrend in a position is one of the easier aspects of trading – as long as the stock behaves!
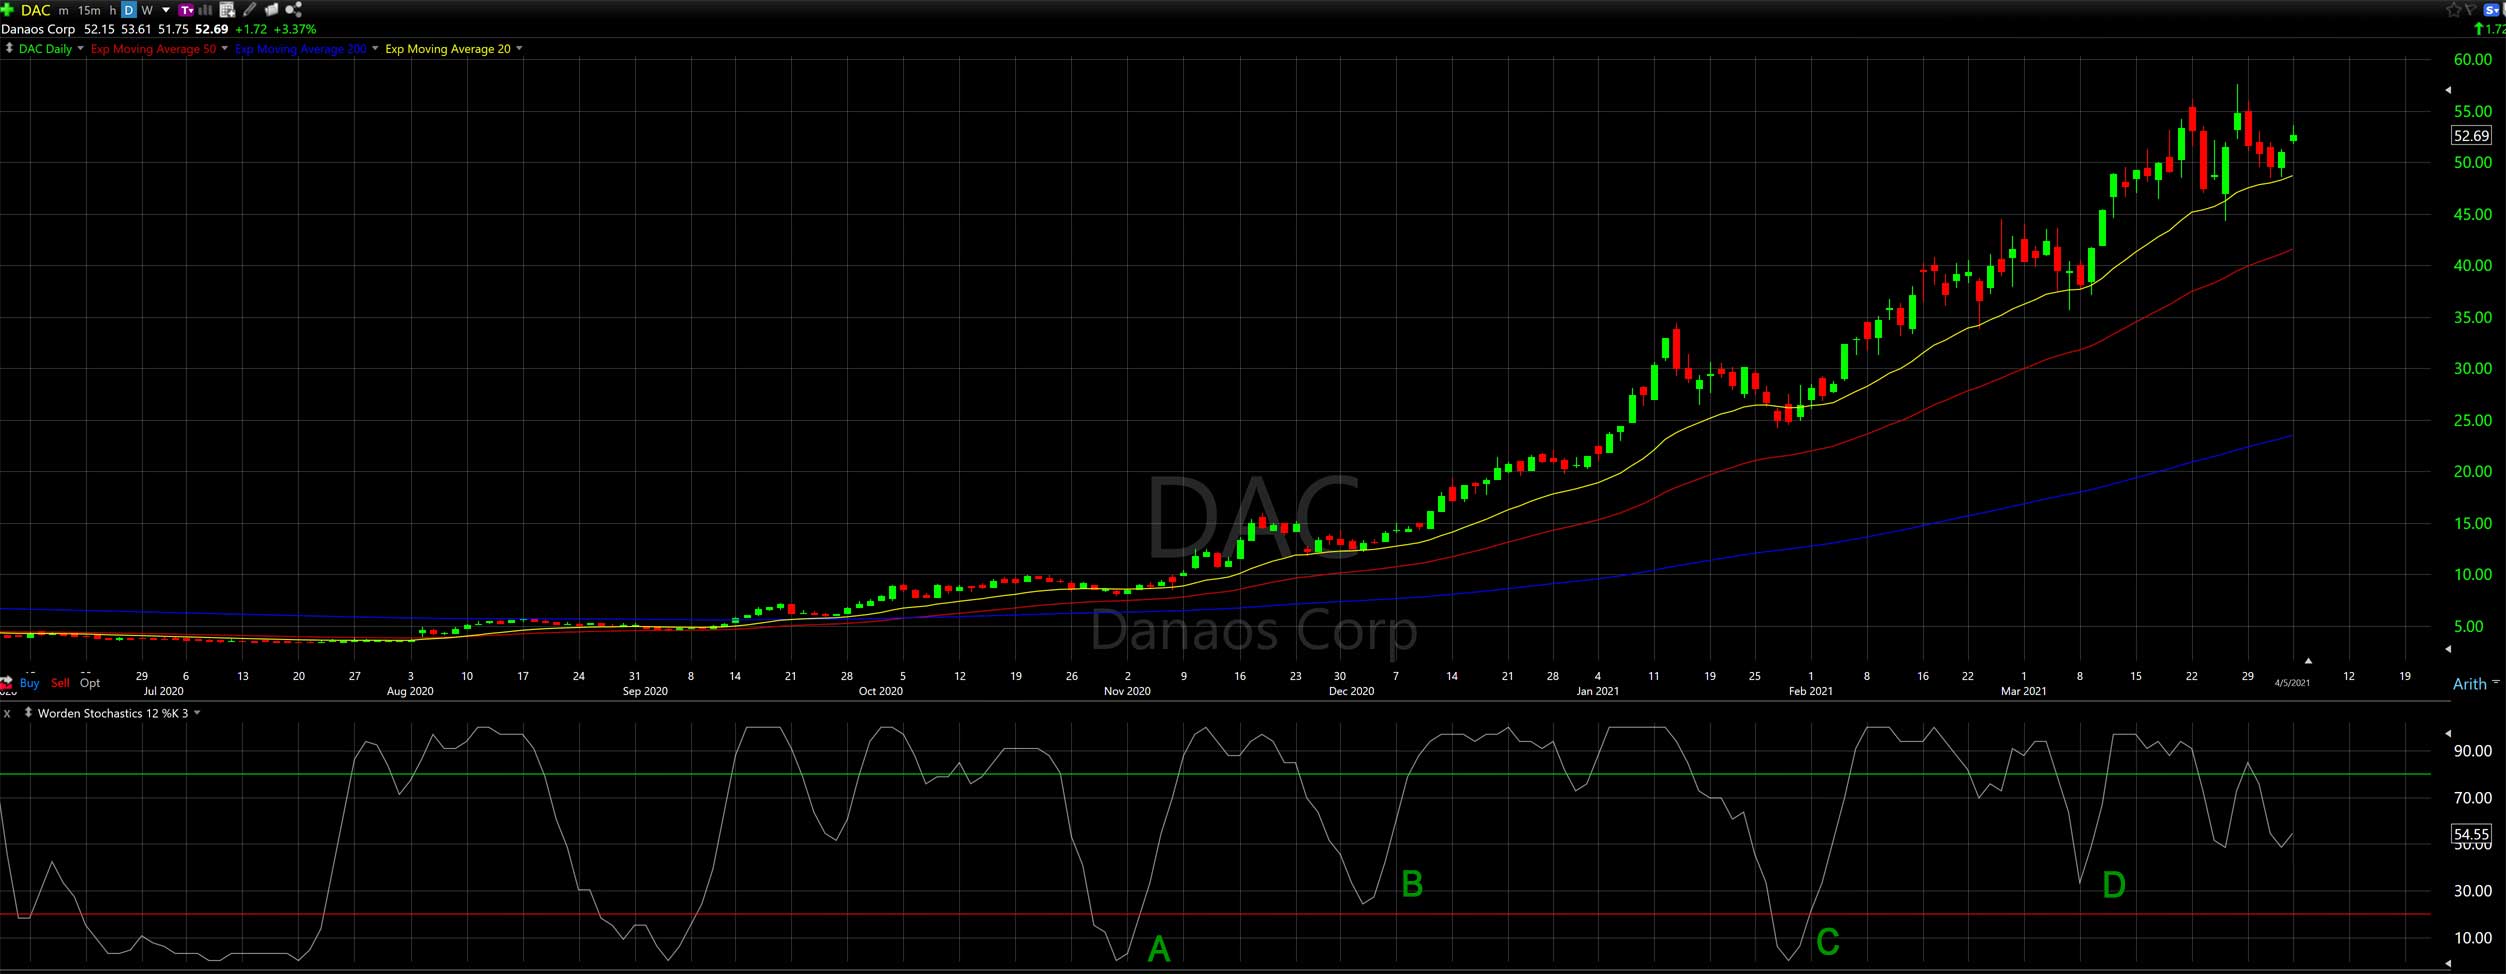
The chart below has a lot of interesting things going on, it’s current as of 4/5/21, which should catch your interest as a starting point. We’ve had a major pullback in a lot of stocks lately, mostly tech and materials, but this chart shows no signs of it.
It’s also one of many stocks I’ve come across lately which began an impressive rally right at election time, which I find interesting. But we’re going to talk about moving stops in a trending stock.
The first thing to notice on this chart is about scaling, something I’ve mentioned before. The first point in time of of interest I have labeled down along the bottom at “A” is back in November. It would be okay if you wondered why we might be interested in the stock at that point in time, it looks kind of calm prior to that time.
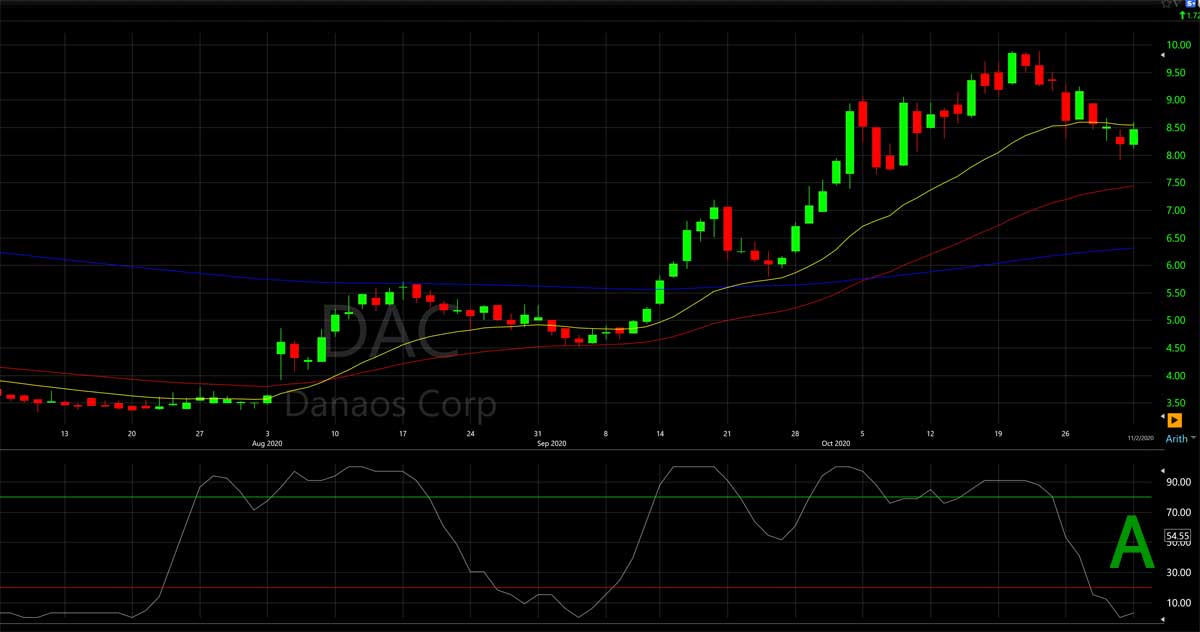
Scroll down to the second pic and you’ll see a close up of the time from early July until beginning of November – election time. It went from $3.50 in early Aug to just under $10 in the beginning of November, 3X in 3 months gets my attention. The point “A” I have labeled corresponds to the “A” in the first pic below.

Close up of DAC from 7/20 – 11/20

So you’re looking at this ticker at point A in time, right after the elections. You’ve had a nice pullback in price, matched with a deep dive in the STOCH into oversold territory, and an upturn in the STOCH, time to buy. The next day you get it at the open for around 8.50. You like the chart so you decide to risk the 10% of capital with the stop. NEVER ENTER A TRADE WITHOUT A STOP, I’VE DONE IT AND GOT BURNED… MORE THAN ONCE. STUPID!!!!
So your stop order, GTC, is set at 8.50 – .0.85 = 7.65, a loss of $85 if you get stopped out on a block of stock.
Now we are going to take advantage of hindsight for purposes of learning. If you look at the first chart above, you’ll see that your entry stop was never hit after you bought – it’s a bit hard to see in the pic above but basically it went sideways for two days then took off.
SO WHEN DO I MOVE MY STOP AND PROTECT GAINS???
This is where it gets easier.
You have two options, depending on how conservative & greedy you are! 🙂
Look at the first chart, at the STOCH between A & B, you can see a little double camel hump up there in the over bought territory. Once it turned up, you could set you stop up to just under there, around 10.50 and you’d be locked in to a minimum gain of 10.50 – 8.50 = 2.00 or $200 for a block. That’s around 25% in a couple of weeks IF you get stopped out, but you don’t on this chart.
If you would have used this methodology on this ticker, and moved your stop (called trailing a stop) at all of the significant oversolds on the STOCH, the letters B, C, & D, you would still be in the stock with a 10X increase.
It’s a thing of beauty, I expect questions. 🙂
You can see that this chart is getting a bit more volatile in the past couple of months, but I’d still consider it a well behaved stock from the traders standpoint. Next we will talk about stocks that misbehave.
Setting a stop after an explosive move in price
The example I am using below IS NOT a good example of a trending stock trade but it has a lot of useful aspects we can use for training purposes. I’ll also talk about a bad mistake I made due to carelessness that turned what should have been a $3,000 gain into a $2,500 loss, a $5,500 swing to the wrong side in my account balance! 🙁
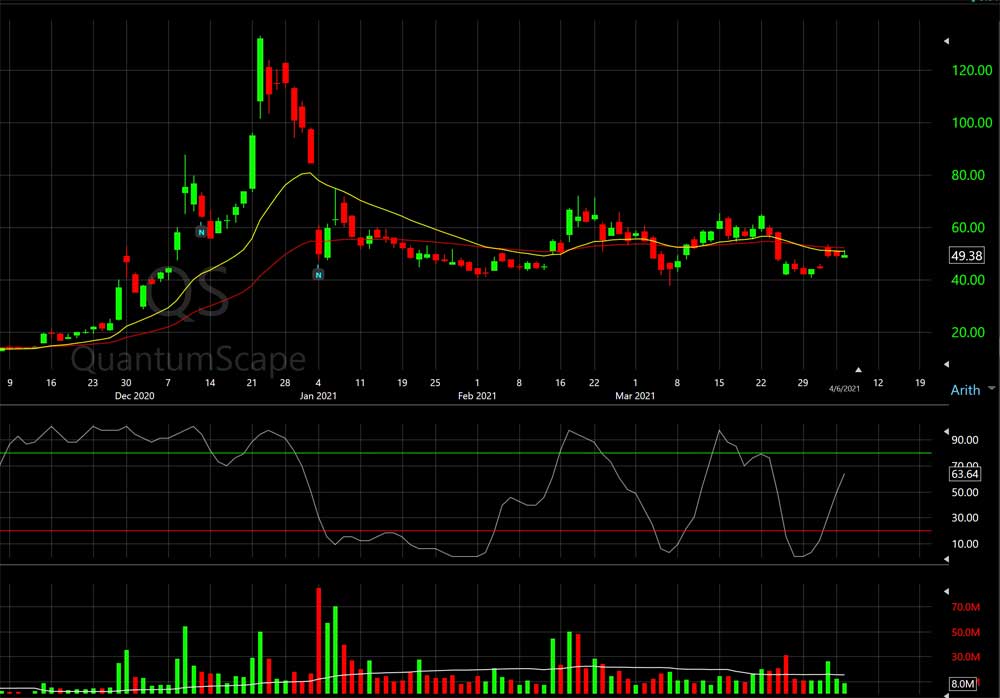
QS is a company which had no product at the time of my trade (it still doesn’t). They had announced a cool development in solid state lithium batteries, a huge valuable market. I had read about the company in November and had been watching it. If you look at the far left price axis, it’s around $15 at the time. Then in late November it shot up to the $50 range, a 2X jump in 2 weeks.
So now I’m eager to chase it, something we should not do, lol. I watched it for about a week then it gapped up on two consecutive days, hitting around $90 on Dec 9th. Two days later it had a pretty good down day and I bought a block at about $67 – that small light blue “N” is the note I put into TC 2000 for my buy. I didn’t set a stop because I knew it was very volatile and wanted to hold on the the position. I only had to wait through one more down day and it was off to the races again, gapping up big time on Dec 22nd to close around $130. I was up about $6K in just over a week, sweet!
Now it was time to put a damn stop in someplace, but where? Gaps tend to be support & resistance points so I decided to not be too greedy and place my stop right under the low of the day on Dec 22nd, about $101 or so. I was very happy locking in a $3k gain in just a couple of weeks on this bad boy.
4 days later, as I expected, it crashed down through my stop. I really didn’t expect this stock to stay this high very long, it’s price move had been fueled by a lot of positive media. But I didn’t care, I had made some bank I told myself. Then I got really sloppy and didn’t log in to my account for a few days. It was the holidays and I was lazy. I finally logged in on Jan 4th, you can see the small “N” in blue there. I was shocked and pissed to find out I still owned QS!!! The stock had just closed down around $45, about $90 off it’s recent high.
WTF had happened??? I started checking on the trade. I was at TD Ameritrade at the time and on their platform, the default setting for a new order is “Day only”. I had forgotten to switch it to “GTC” – good till canceled!
That second “N” is where I set a new stop around $45 – GTC, hoping it would recover and I’d still make some money on it. About 2 weeks later I got stopped out for about a $2500 loss. My carelessness had cost me nearly $6000. DON’T GET SLOPPY!!! LOL

