Trend Following
To begin, many traders use different time frames in their charts. While a day trader may be using 1 minute, 5 minute charts, etc, I take my trading signals from the daily time frame. However I often look at the 15 minute or hourly charts for a closer look & timing of entries and exits. My criteria for adding a ticker to my active watchlist is at least 6 months of an uptrend. I never trade in the direction opposite to the trend of the S&P 500. Keep in mind that often trends on different time frames will disagree with one another for given ticker. In addition to scanning sectors of charts to find trending stocks, I also keep an eye on other sources, such as business news, when looking for new tickers to add to the watch list. I continuously add and remove tickers from my active watch list as I find new ones and remove those which have stopped trending to my liking. For your convenience I post my current list here.
So how do I define a trend?
The definition of an uptrend is higher highs & higher lows, in my case on the daily chart.
After I have identified a trend, the next thing I want to check before adding the stock to my list is how much has the stock increased in price, on a percentage basis, in the past 6 months. It’s important to keep in mind that charting software always draws the chart to fill the entire vertical space that’s available, according to how you have your screen laid out. This can make the trend look like a nice opportunity if you don’t pay attention. So we need to check the vertical axis of the chart, over on the right where the price is, to get this information.
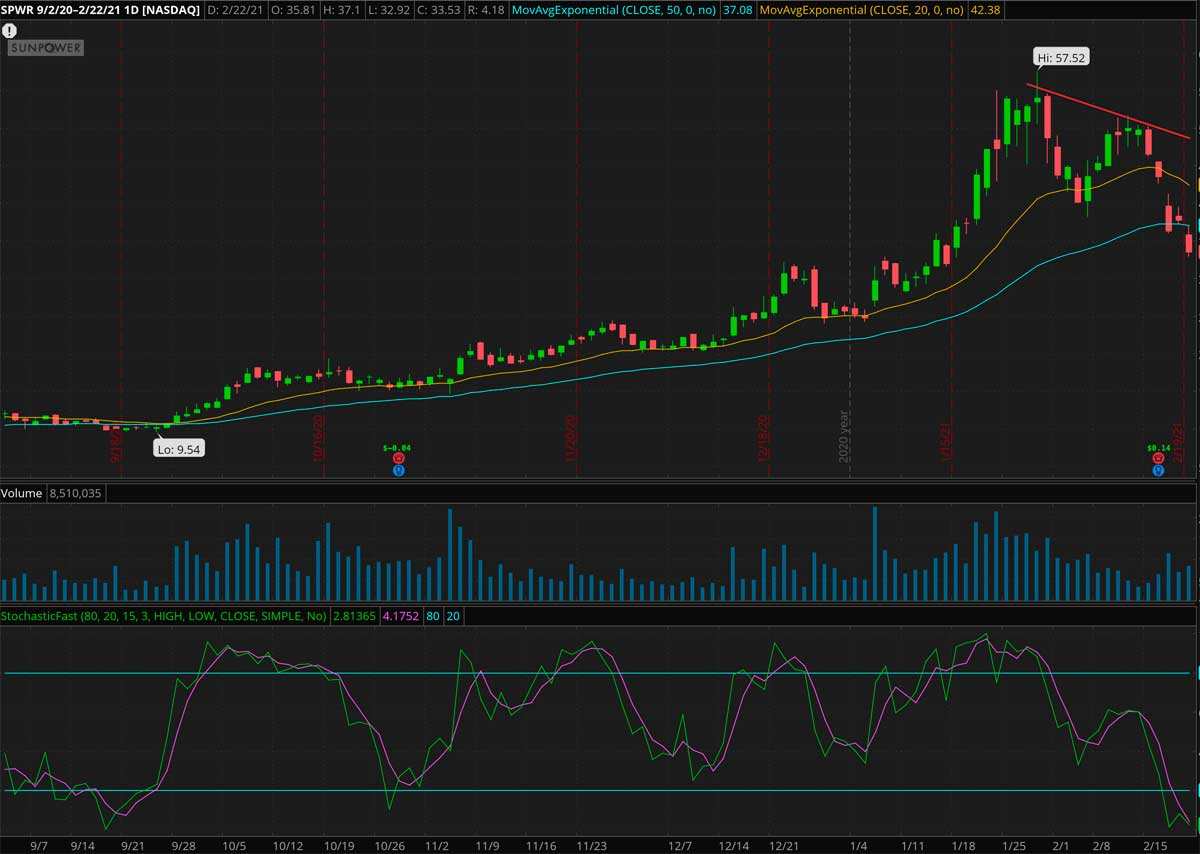
Look at the chart below of Sunpower (SPWR), a ticker I have traded a couple of times. If you look at it’s recent price peak in January, it got up around $55 before pulling back hard. If you look at the left end of the horizontal axis at the bottom of the chart, you’ll see it was down around $9.50 back in September. That’s about a 6X increase in price, very nice. Also important to note is this stock is beginning a reversal of it’s uptrend over at the far right edge. It will be interesting to keep an eye on it as this is a solar stock, a very hot sector lately.
UPDATE:
As I was creating this page, SPWR was kind enough to demonstrate a trend reversal on the daily chart. Note the red line at the top right of the chart. As you can see we have a pair of lower highs & lower lows forming (the second low isn’t done forming yet), supported by a much more oversold STOCH indicator on the final day. Both EMA’s are also turning down. This is all pretty bearish in at least the short time frame.

Smooth trends VS. ratty trends
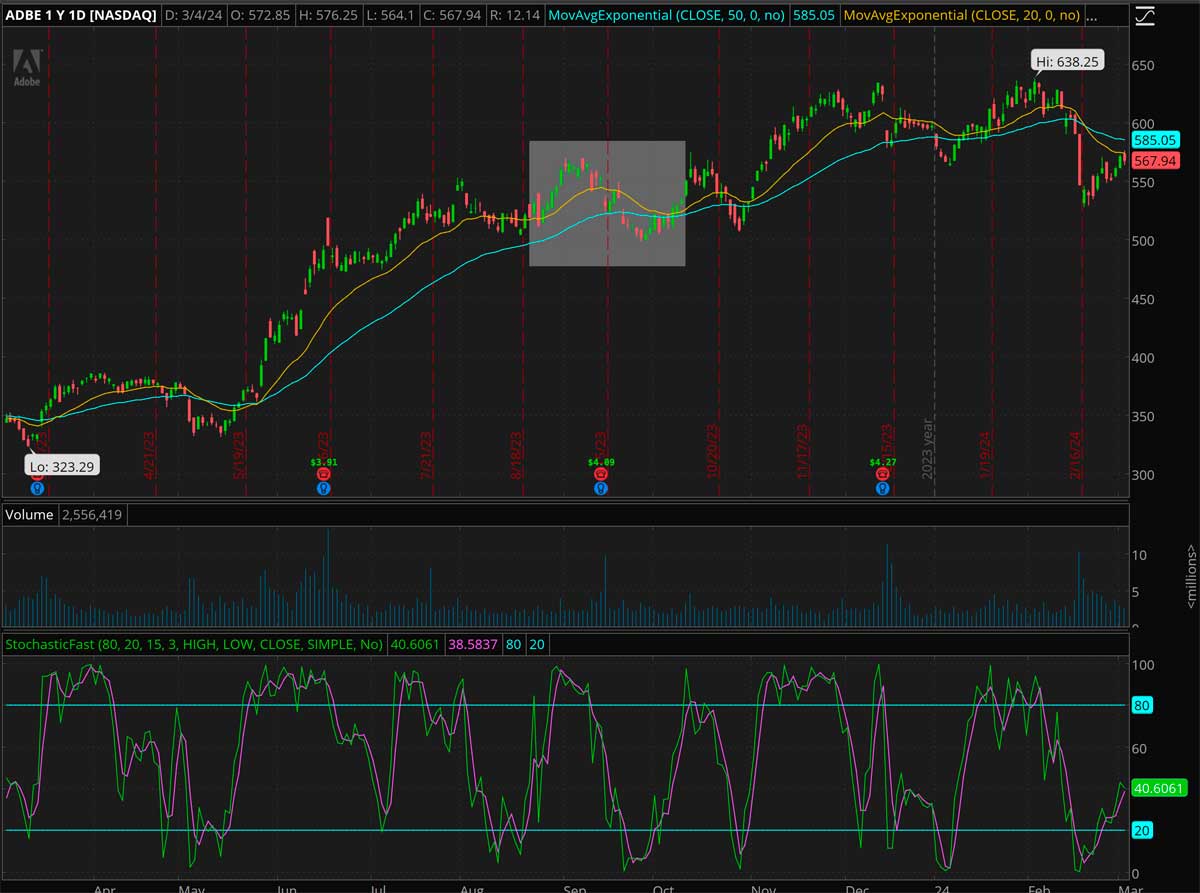
The first chart below is for Adobe, a 1 year chart as of March 4, 2024. If you look at the price axis it was up over 100% in 1 year, an excellent move! But if you look at the grey box, the peak in there was about $568 and the low was about $497. That’s a 12.5% hit. The fast EMA also took a nose dive in there, a sign of a potential trend reversal. The slow EMA akso started down a tad in there, no thanks. Then just to the right of the box it basically repated it. That would rive me nuts lol. Look at he severe volitilty of the stoch’s as well, no thanks. On a side not, I woild consider this as a short term option play but we’ll cover that in another section of the site.

Good Trends
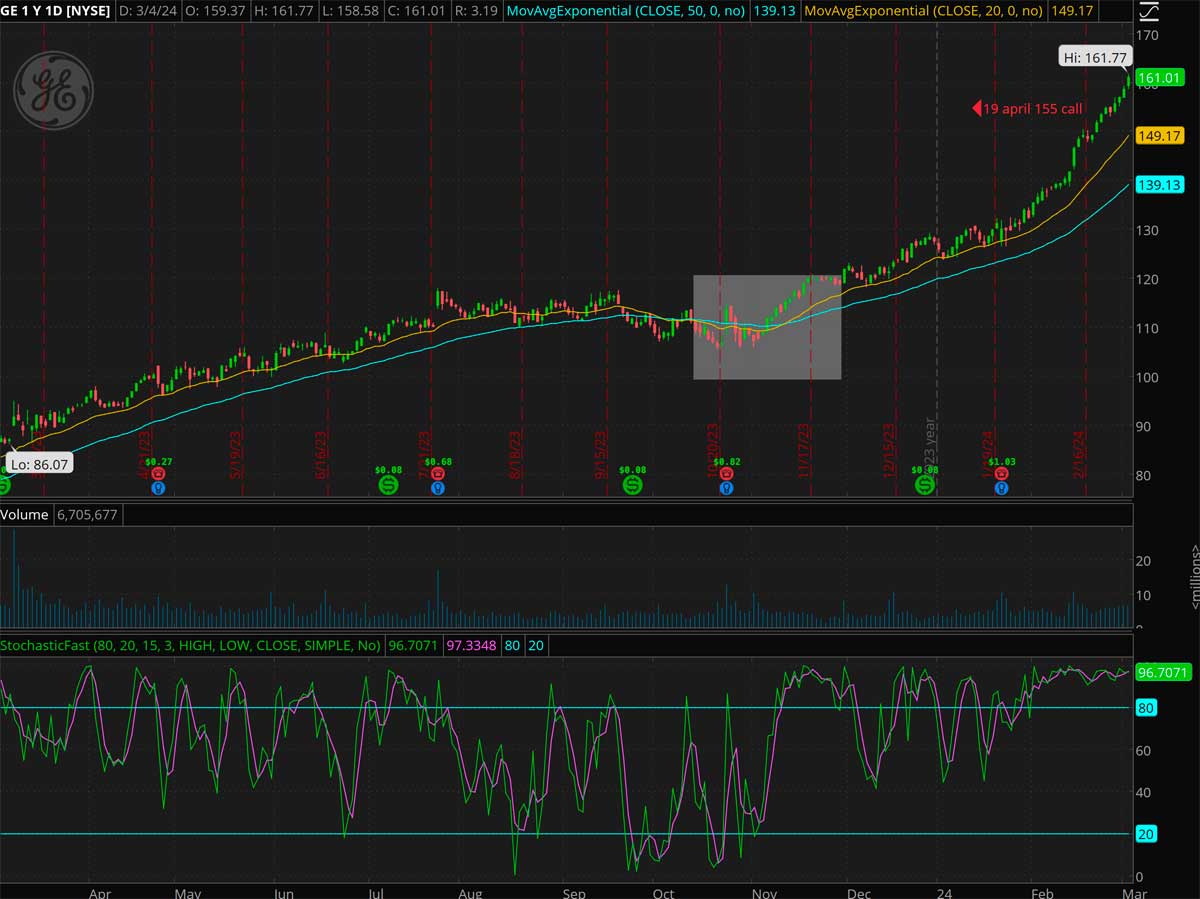
Take a look at the GE chart below, there are several things to know about it. This is a 1 year daily chart as of March 4, 2024. First notice the nice uptrend at the beginning, very smooth and easy to trade. If you look carefully at the dates along the bottom you can see it started to flatten out in July, 2023. I felt we were entering a bear market near the end of July and went 100% cash in my IRA account. Although GE weathered it well, many people lost serious money from July to the index reversal in October, 2023.
You can see in the gray box where GE took off, the fast EMA crossed above the slow and the stochs took off and became less volitile. From Oct to the date at the end GE was up around 50% in six months, a nice move. Both EMA’s ramped up and kept a nice spread between them , with the stochs going overbought and staying there. Beginning with the dip in the stoch at the right edge of the gray box, every dip in the stoch was a great, very comfortable entry point.
Also notice the red text at the top right of the chart that says ’19 april 155 call.’ I had been following GE for quite a while and wanted to play it but my main account was 100% in the markets enjoying a nice ride over the previous few months after the bottom in the past October. I geting tired of watching it go up so around the 3rd week of February I had freed up some cash in my option account. I decided to go long an April 155 call with an expiration date of 19 April, giving me about two months to play it. For reasons I’ll explain in the option section of the site I actaully only had about a month for the trade. If the price keeps this pace it’s going to be a challenging exit! lol
Here’s the real important part you want to understand, and why I trade options without margin. The price is currentlt 161.77 as you can see at the top right of the chart, an all time high for GE. If I had bought a block of it at 155, I’d be up ~4.37%, not shabby for a few weeks hold. However I didn’t have the cash so I went for a call option. I bought one call contract for $423. As of today it’s worth $676, a gain of $253 or 59.8%!
4.37% or 59.8%, which would you prefer lol. Today the stock was up $2.36 but the option was up $172 or 34.6% in one day. That’s the other cool thing about options, the further you get ‘in the money’ or above the strike price you bought, the faster it climbs. Again I’ll cover this in more detail elsewhere.
The truth is I have more losing option trades than winners, but my methods get me out of the losers early and keep me in the winners longer, making profits nearly impossible to match by simply buying the underlying stock. You can also make a lot more money with options with limoted cash, a great way to start. A couple of thousand bucks will get you in the game.

