Timing your entries for safety using probability
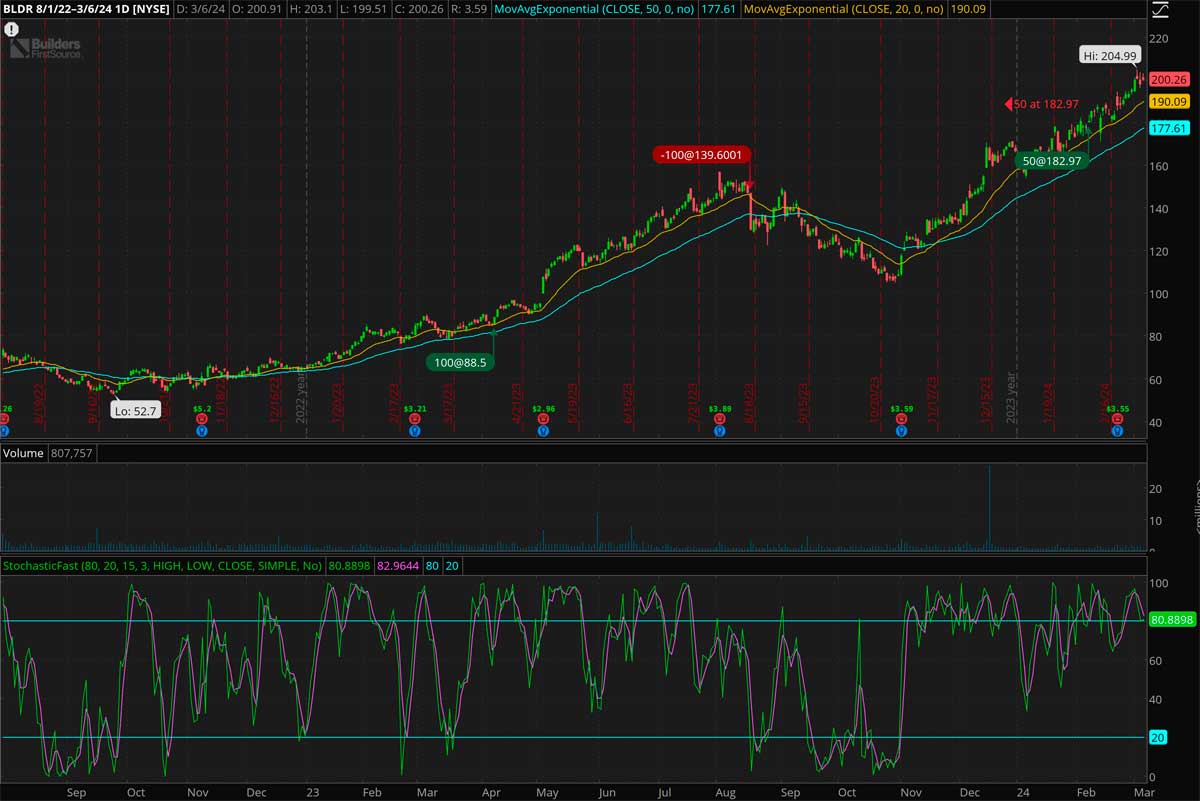
Once you have a list of trending stocks, it’s time to identify buy points. Before I go through this chart of BLDR I want to explain a couple of things to prevent confusion. First this chart is an expanded time frame to make it more useful or learning. It’s a daily chart beginning around Aug 1, 2022 and goes through todays date, March 6, 2024. Next, the white box on the far left showing the low and the high at the far right, just a few days ago, along with the red and green boxes showing my entries & exits are all drawn by the Think or Swim (TOS) paltform, very handy.
The red text you see at the far right just above my last buy was entered by me manually. The reason it’s there is because the TOS software was a product of TD Ameritrade and was bought by Schwab recently. For a while there were some bugs and it wasn’t putting the buys & sells in so I was doing it manually. I find it very useful to see all my entries & exits on the charts I’m trading for many reasons including spotting past mistakes.
The horizontal lines going through the stoch chart on the bottom represent times when the stock was overbought & oversold. The concept is that a stock will spend most of it’s time in the center region, when it goes above or below these lines you should expect a reversion to the norm in the middle. This is part of the ‘probability’ aspect of my trades. The lines are adjustable so you can tailor them to an individual stock but I generally leave mine at 80% and 20%.

First off, what caught my attention about this stock? Realize that because of how the charts draw things, and the large time frame of this chart, almost two years of data, the slope in the beginning of it looks pretty dull. However thta low on the left of 52.7 hsows us the stock has increased by about 4X in under two years, a very nice run. But it looks a bit lazy at the time of my first buy @ 88.5. But check the numbers, it had gone from 52.7 to 88.5, a 67,9% increase in about 6 months. That, along with a pretty low volatility, smoothe slope is enough to get my attention. I suspect it came on my radar a month or two before my first buy. Now look at the two deep dips in the stochs below the 20% line right before I bought the first time. A lower dip in the second stoch, or a lower pirce dip in the second dip would have been a contra indication of the continuation of the uptrend. The EMA’s were also doing well with an uptrend and a spread between them, another good sogn of trend strength. When do I buy? Look at the dip where I bought. The fast stoch barely passed 60 before it reversed upward. The reversal of the fast stoch and crossing of the slow stoch was my buy signal. I held the position until early Augist for a return of ~ 58% in about 4 months, I’ll take that all day long. As you can see the stochs never went over sold during that period and indication of a strong trend.
When & why did I exit? First off, I was seeing a sea of red on my watch list during the month of July. Everything seemed to be getting weaker including the S&P. I became convinced we were seeing a significant top in the markets. That huge red candle where I sold had a huge dip in the stochs. I bailed mid day about half way down the price drop on that day. By the beging of August I was 100% cash in my account. I nailed the top and saved me a lot of losses in the account.
By early October I was seeing reversals in most of my list. I remember sitting with an old friend in early October at breakfast. He was feeling a bit bummed about is very sizable 401K account. He asked me when I thought the downtrend would end. I said Matt, I’m not sure but I think it’s happening now. By early December I was mostly back in the markets. I did trade some short options during the downtrend and did pretty well.
Another thing worth mentioning here. Since I was nearly 100% invested I kept watching this stock and feeling bad I wasn’t back in it, not enough cash. Somewhere in the beginning of the year I bailed on a lagger and had some funds to play with so I was eager to get back in BLDR. As you can see there were a couple of nice dips in the stochs prior to my buy but I didn’t have the cash yet. Also notice that the stochs stayed mostly overbought beggining early November, showing a strong trend, as many stocks were at the time. So I bent the rules a bit. I bought in again Feb 6th, when the fast stoch crossed above the slow stoch, however the dip barely broke the overboufht line on the stochs.
As of today, March 6, I’m still holding the position, up about 12%, but the money aint in the bank until I exit the position!
Exits are bar far the most difficult part of trading. If I nail another top I will be quit surprised. Time will tell.
